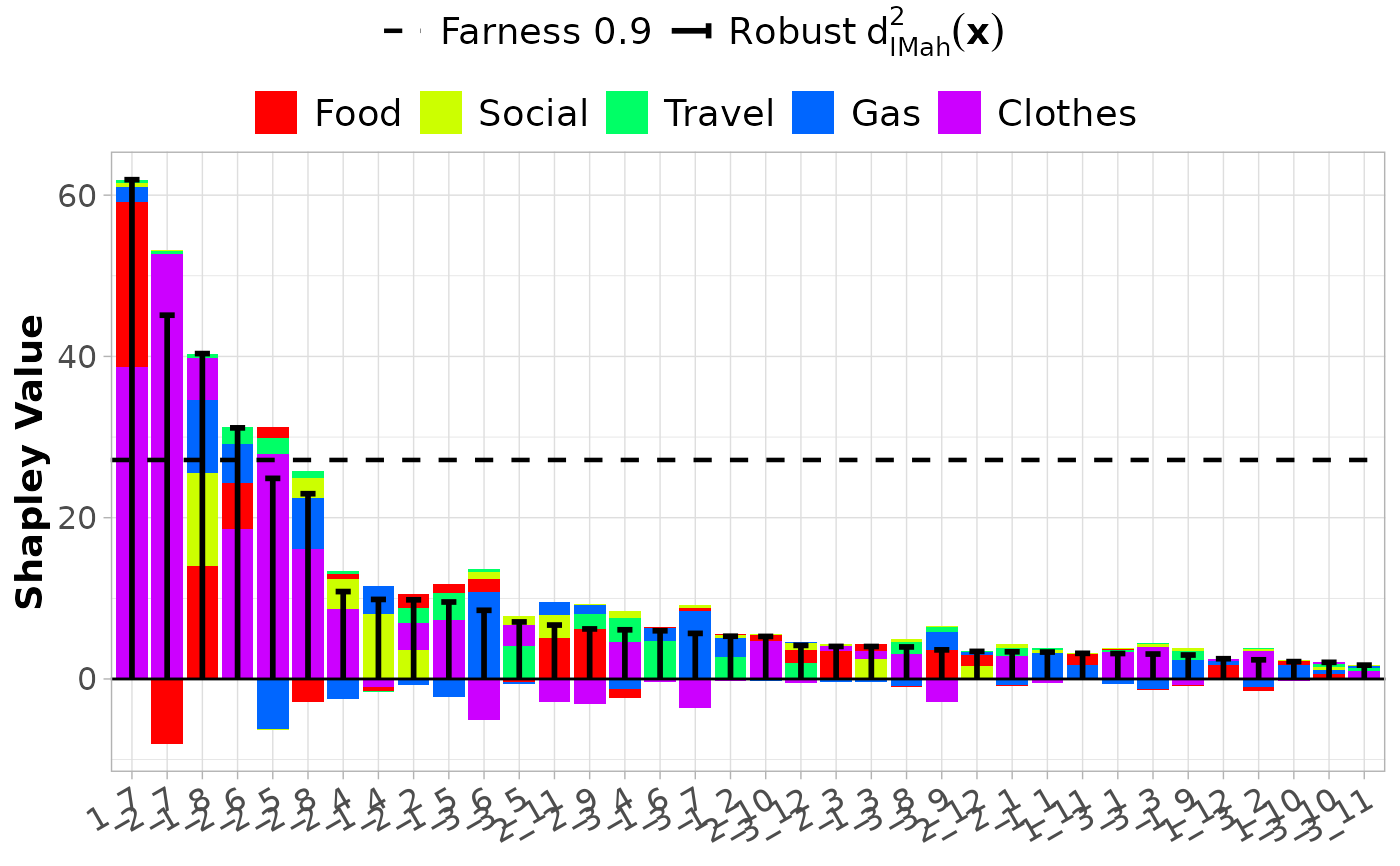
Barplot of Shapley values for Interval-valued Data
Source:R/plots_Shapley.r
plot_bar_int_Shapley.RdBarplot of Shapley values for Interval-valued Data
Usage
plot_bar_int_Shapley(
  x,
  cutoff_value = NULL,
  cutoff_label = NULL,
  palette = NULL,
  abbrev.var = 20,
  abbrev.obs = 20,
  sort.obs = TRUE,
  plot_IMah = TRUE,
  IMah_label = expression(Robust ~ d[IMah]^2 * (bold(x))),
  rotate_x = TRUE
)
Arguments
- x
A \(n \times p\) matrix containing the Shapley values of \(n\) observations and \(p\) variables.
- cutoff_value
Numeric. The cutoff value used for detecting outliers. If
cutoff_valueis notNULL(default), the cutoff value is included in the plot.- cutoff_label
Character. Label for the cutoff value line in the plot.
- palette
A vector with colors for each variable. If
paletteisNULL(default), the colors are generated usingRColorBrewer.- abbrev.var
Integer. If
abbrev.var\(> 0\), column names are abbreviated using abbreviate withminlenght = abrev.var.- abbrev.obs
Integer. If
abbrev.obs\(> 0\), row names are abbreviated using abbreviate withminlenght = abrev.obs.- sort.obs
Logical. If
TRUE(default), observations are sorted according to their squared (robust) Interval-Mahalanobis distance.- plot_IMah
Logical. If
TRUE(default), the squared (robust) Interval-Mahalanobis distance will be included in the plot.- IMah_label
Character. Label for the Interval-Mahalanobis distance in the plot legend. Default is "Robust \(d_\mathrm{IMah}^2(\boldsymbol{x})\)".
- rotate_x
Logical. If
TRUE(default), the x-axis labels are rotated.
Value
Returns a barplot that displays the Shapley values (int_Shapley) for each observation and optionally (plot_IMah = TRUE)
includes the squared (robust) Interval-Mahalanobis distance (IMah_dist) (black bar) and the corresponding outlier detection cut-off value (dotted line).
References
Adapted from package ShapleyOutlier (https://CRAN.R-project.org/package=ShapleyOutlier).
Examples
# Create intData object
data(creditcard)
credit_card_int <- creditcard$intData

# Estimate the mean and covariance matrix
credit_card_IMCD <- IMCD(credit_card_int,
                         m = floor(nrow(credit_card_int)*0.75),
                         cutoff = "farness",
                         cutoff_lvl = 0.9)

# Detect outliers using farness cutoff
credit_card_outliers <- int_outliers(credit_card_IMCD$robust_dist,
                                     cutoff = "farness",
                                     cutoff_lvl = 0.9)

# Compute Shapley values
credit_card_shapley <- int_Shapley(credit_card_int,
                                   mean_c = credit_card_IMCD$mean_IMCD_c,
                                   mean_r = credit_card_IMCD$mean_IMCD_r,
                                   cov = credit_card_IMCD$cov_IMCD)

# Plot Shapley values with cutoff line and Interval-Mahalanobis distance
plot_bar_int_Shapley(credit_card_shapley,
                    cutoff_value = credit_card_outliers$cutoff_value,
                    cutoff_label = "Farness 0.9",
                    palette = rainbow(credit_card_int@NIVar))