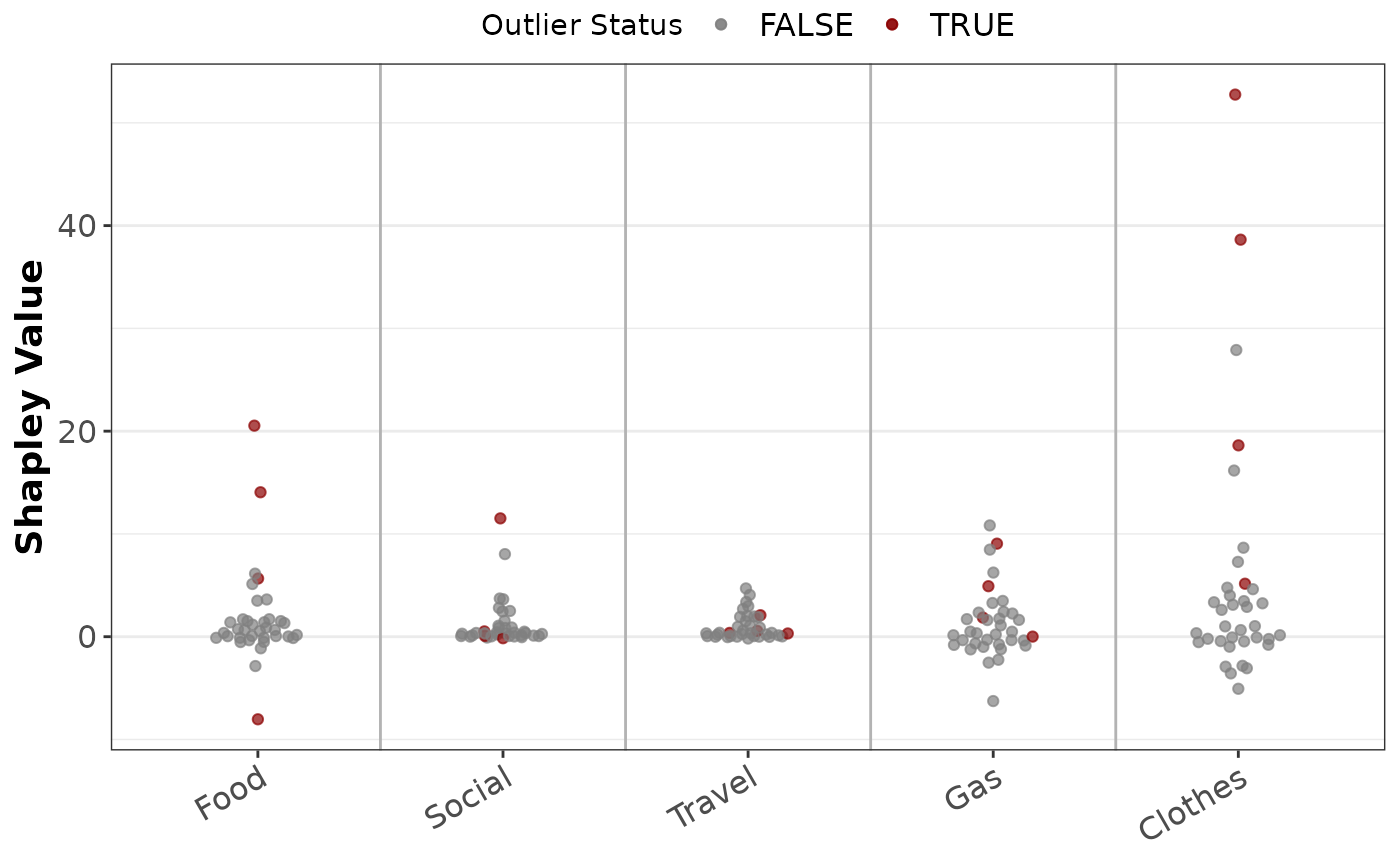
Beeswarm plot of Shapley values for interval-valued data.
Source:R/plots_Shapley.r
plot_beeswarm_int_Shapley.RdBeeswarm plot of Shapley values for interval-valued data.
Usage
plot_beeswarm_int_Shapley(
  shapley,
  color_class,
  color_label = NULL,
  palette = NULL,
  rotate_x = TRUE,
  shape_class = NULL,
  shape_label = NULL,
  ggplotly = FALSE,
  label_obs = NULL,
  y_limits = NULL
)
Arguments
- shapley
A \(n \times p\) matrix containing the Shapley values of \(n\) observations and \(p\) variables.
- color_class
A vector indicating the color class of each observation. If NULL (default), all points have the same color.
- color_label
Character. Label for the color class. If NULL (default), no legend for the color class is shown.
- palette
A vector with colors for each color class. Default is NULL.
- rotate_x
Logical. If
TRUE(default), the x-axis labels are rotated.- shape_class
A vector indicating the shape class of each observation. If NULL (default), all points have the same shape.
- shape_label
Character. Label for the shape class. If NULL (default), no legend for the shape class is shown.
- ggplotly
Logical. If
TRUE(default), the plot is converted to an interactive plotly object.- label_obs
A vector with the names of the observations to be labeled in the plot when
ggplotly = FALSE. Default is NULL.- y_limits
A numeric vector of length 2 specifying the limits for the y-axis. Default is NULL, so the limits are determined automatically.
Value
Returns a beeswarm plot that displays the Shapley values (int_Shapley) for each observation and feature.
Examples
# Create intData object
data(creditcard)
credit_card_int <- creditcard$intData

# Estimate the mean and covariance matrix
credit_card_IMCD <- IMCD(credit_card_int,
                         m = floor(nrow(credit_card_int)*0.75),
                         cutoff = "farness",
                         cutoff_lvl = 0.9)

# Detect outliers using farness cutoff
credit_card_outliers <- int_outliers(credit_card_IMCD$robust_dist,
                                     cutoff = "farness",
                                     cutoff_lvl = 0.9)

# Compute Shapley values
credit_card_shapley <- int_Shapley(credit_card_int,
                                   mean_c = credit_card_IMCD$mean_IMCD_c,
                                   mean_r = credit_card_IMCD$mean_IMCD_r,
                                   cov = credit_card_IMCD$cov_IMCD)

# Beeswarm plot of Shapley values colored by outlier status
plot_beeswarm_int_Shapley(credit_card_shapley,
                     color_class = credit_card_outliers$is_outlier,
                     palette = c("gray50", "darkred"),
                     color_label = "Outlier Status")