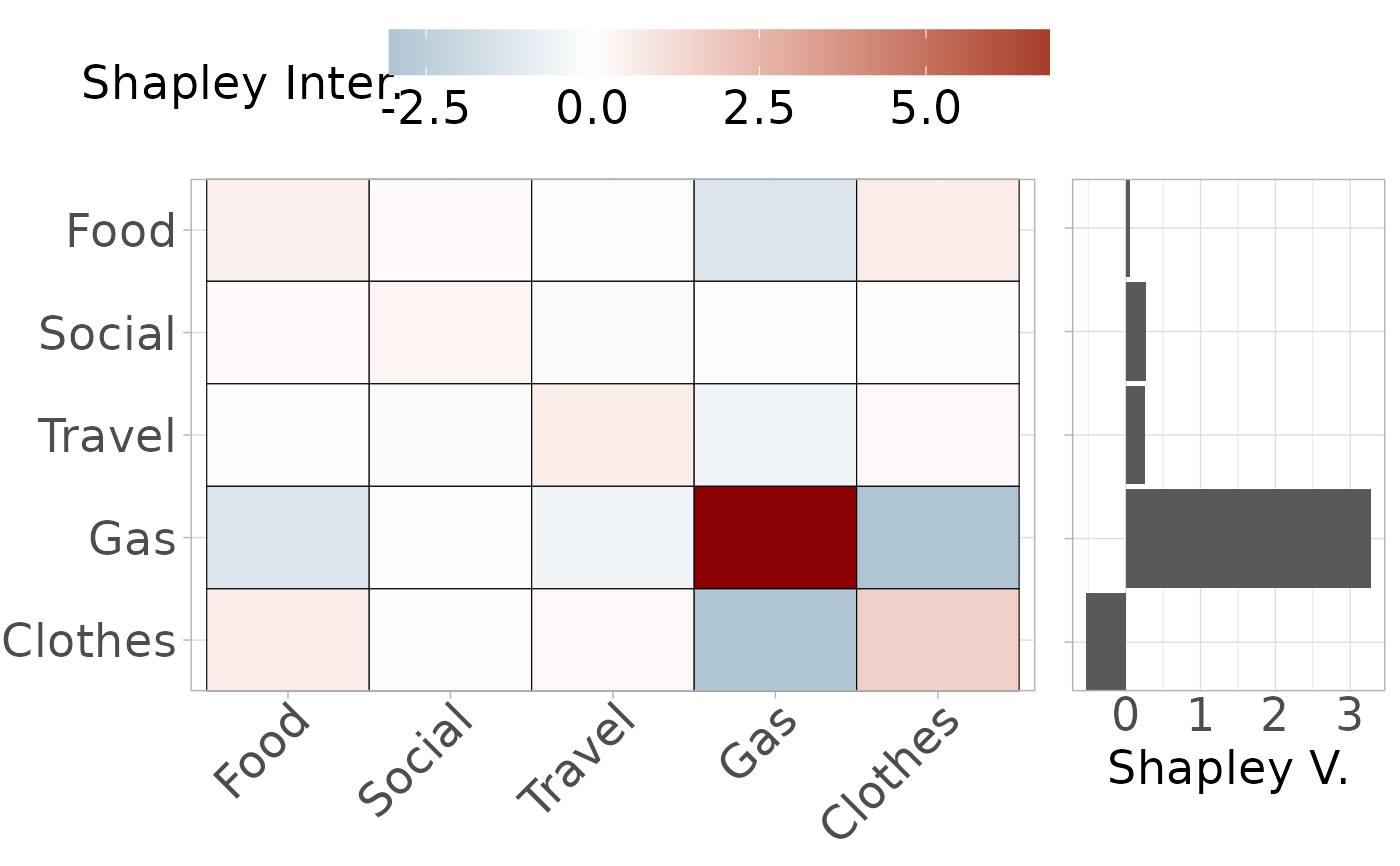
Plot Shapley interaction indices
Arguments
- x
A \(p \times p\) matrix containing the Shapley interaction indices of a single observation.
- abbrev
Integer. If
abbrev.var\(> 0\), variable names are abbreviated using abbreviate withminlenght = abrev.- title
Character. Title of the plot.
- legend
Logical. If TRUE (default), a legend is plotted.
- text_size
Integer. Size of the text in the plot
Value
Returns a figure consisting of two panels. The right panel shows the Shapley values, and the left panel the Shapley interaction indices.
References
Adapted from package ShapleyOutlier (https://CRAN.R-project.org/package=ShapleyOutlier).
Examples
# Create intData object
data(creditcard)
credit_card_int <- creditcard$intData

# Estimate the mean and covariance matrix
credit_card_IMCD <- IMCD(credit_card_int,
                         m = floor(nrow(credit_card_int)*0.75),
                         cutoff = "farness",
                         cutoff_lvl = 0.9)

# Compute Shapley interaction indices
credit_card_shap_inter <- int_Shapley_interaction(credit_card_int,
                                                  mean_c = credit_card_IMCD$mean_IMCD_c,
                                                  mean_r = credit_card_IMCD$mean_IMCD_r,
                                                  cov = credit_card_IMCD$cov_IMCD)

# Plot Shapley interaction for 1st observation
plot_int_Shapley_inter(credit_card_shap_inter[[1]])